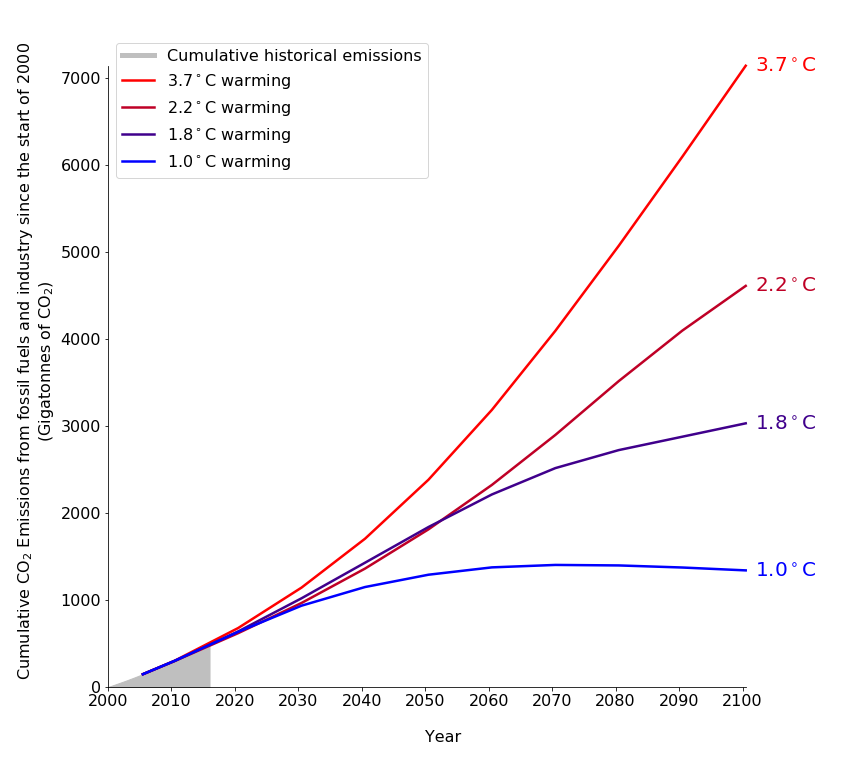
Chart showing cumulative CO2 emissions by year from 2000 to
2100. The red
curve to 3.7 degrees C is the path if we make no attempt
whatsoever to curb our emissions, the other paths are with
varying levels of emissions reductions and the blue 1.0 degrees C
path is with extremely aggressive emission reductions coupled
with aggressive removal of CO2 from the atmosphere. This shows
that if we make zero attempt to reduce emissions, we
will emit 6.1 trillion tons of CO2 between 2020 and 2100.
Source:
here.
|
